The Real Cost of the Coverage Gap

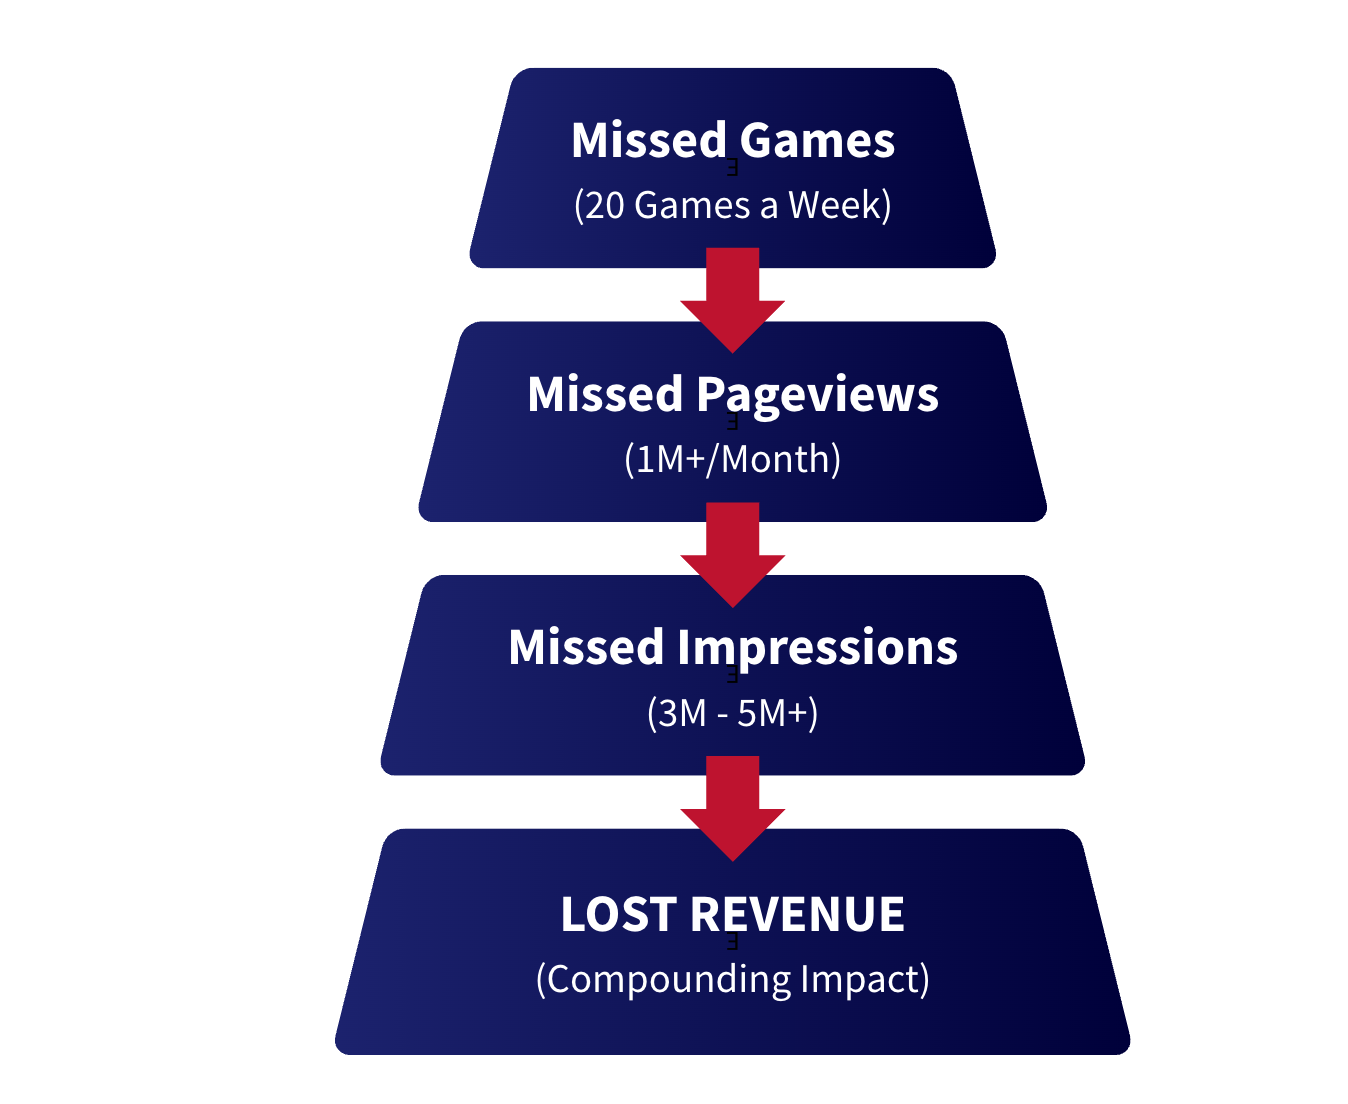
Switzerland.- November 19,2026 www.zonadeazar.com Understanding the match lifecycle reveals where opportunity exists. What it does not immediately show is the full scale of what is lost when those opportunities are missed. The cost of the coverage gap is not theoretical. It is measurable, repeatable, and compounding.
Search Visibility Loss
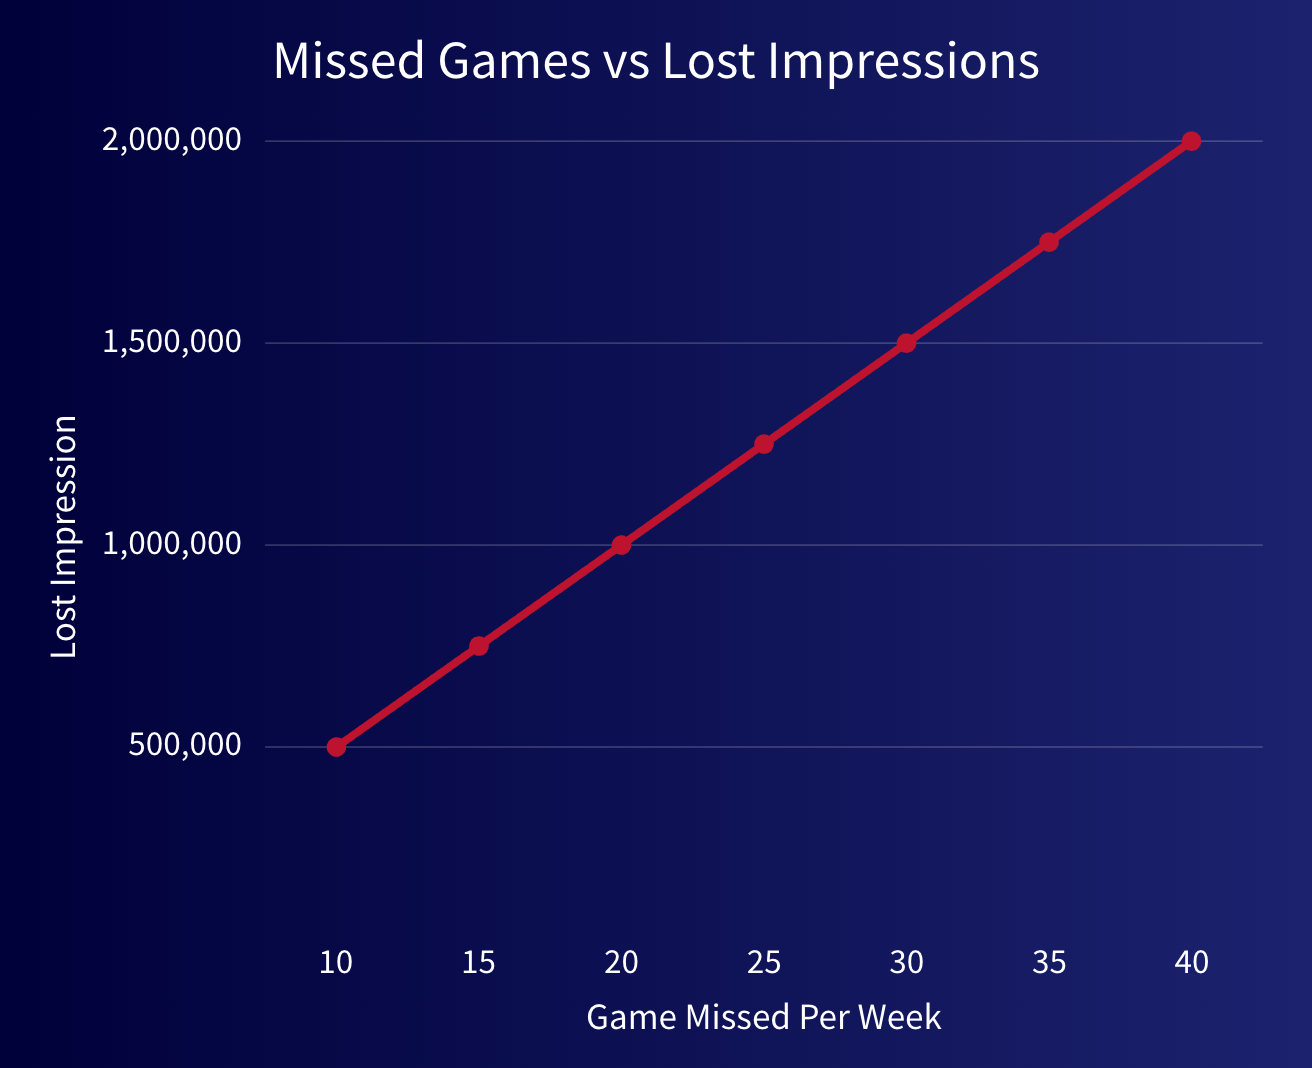
For example, if a publisher covers only 20 out of 50 weekly games with pre-game content, that leaves 30 games where high-intent queries are being satisfied elsewhere. At scale, this results in hundreds of thousands, or even millions, of lost impressions over time.
Engagement Loss
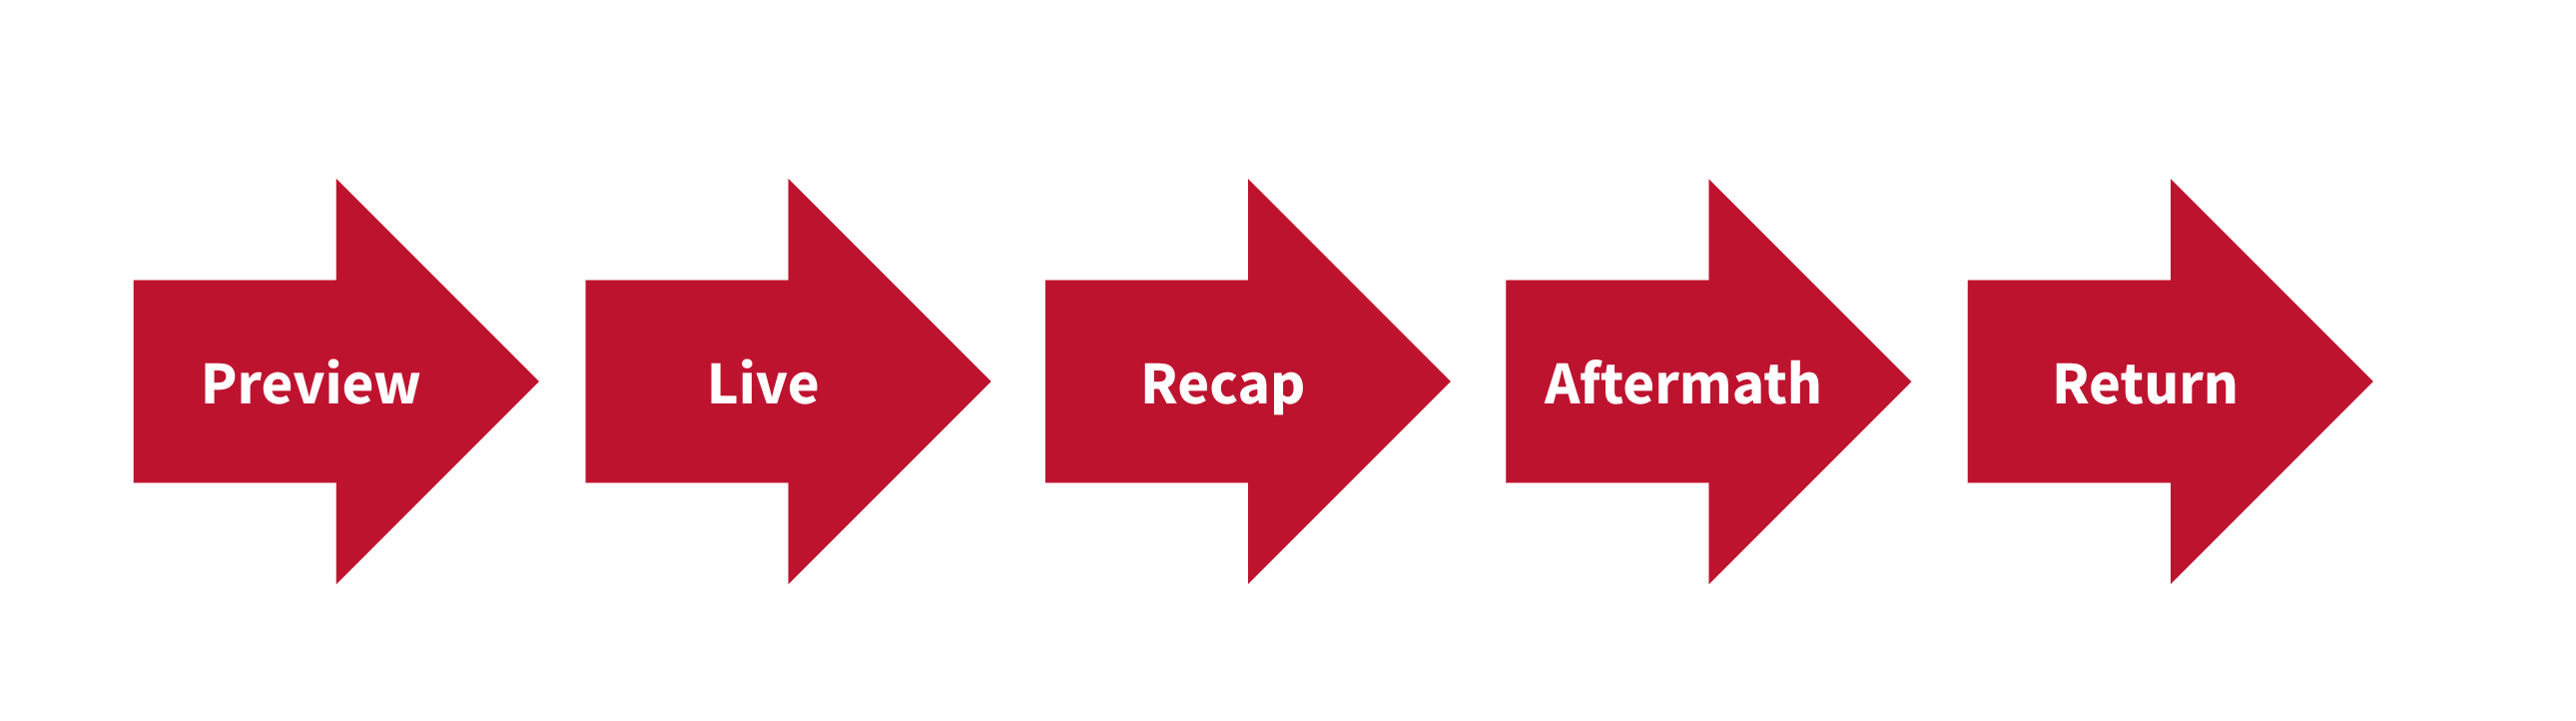
Data shows that users who visit more than one page are 2–3x more likely to return. Missing early or late-stage content reduces the likelihood of repeat sessions, directly impacting total pageviews per user.
Revenue Loss
The financial consequences of this gap are significant. Live content can deliver 1.5–3x higher CPMs compared to standard display inventory. Return visits increase total ad impressions per user, and early-stage content improves overall search visibility.
Consider a publisher missing coverage for 25 games per week, with an estimated 40,000 potential pageviews per game across the lifecycle. That equates to 1 million lost pageviews weekly. Over the course of a month, that is more than 4 million missed impressions—traffic that competitors are monetizing instead.
The Compounding Effect
The most important characteristic of this loss is that it compounds. Missed content reduces visibility, reduced visibility lowers engagement, and lower engagement ultimately impacts revenue growth. Over time, this creates a widening performance gap between publishers who capture lifecycle demand and those who do not.
What begins as a content gap becomes a structural disadvantage.
@_fonta


